 Signing into the website
Today we tried out using the initial version of the website for supporting the pond habitat observation activity. Six tutors from Preston Montford joined us (Jim, Javi, Dave and myself) and they used the system to enter and view some data at the Preston Montford pond. The feedback and suggestions they then gave us were really encouraging, and has given us lots of ideas for ways of developing the site to support this activity.
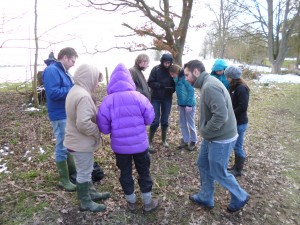
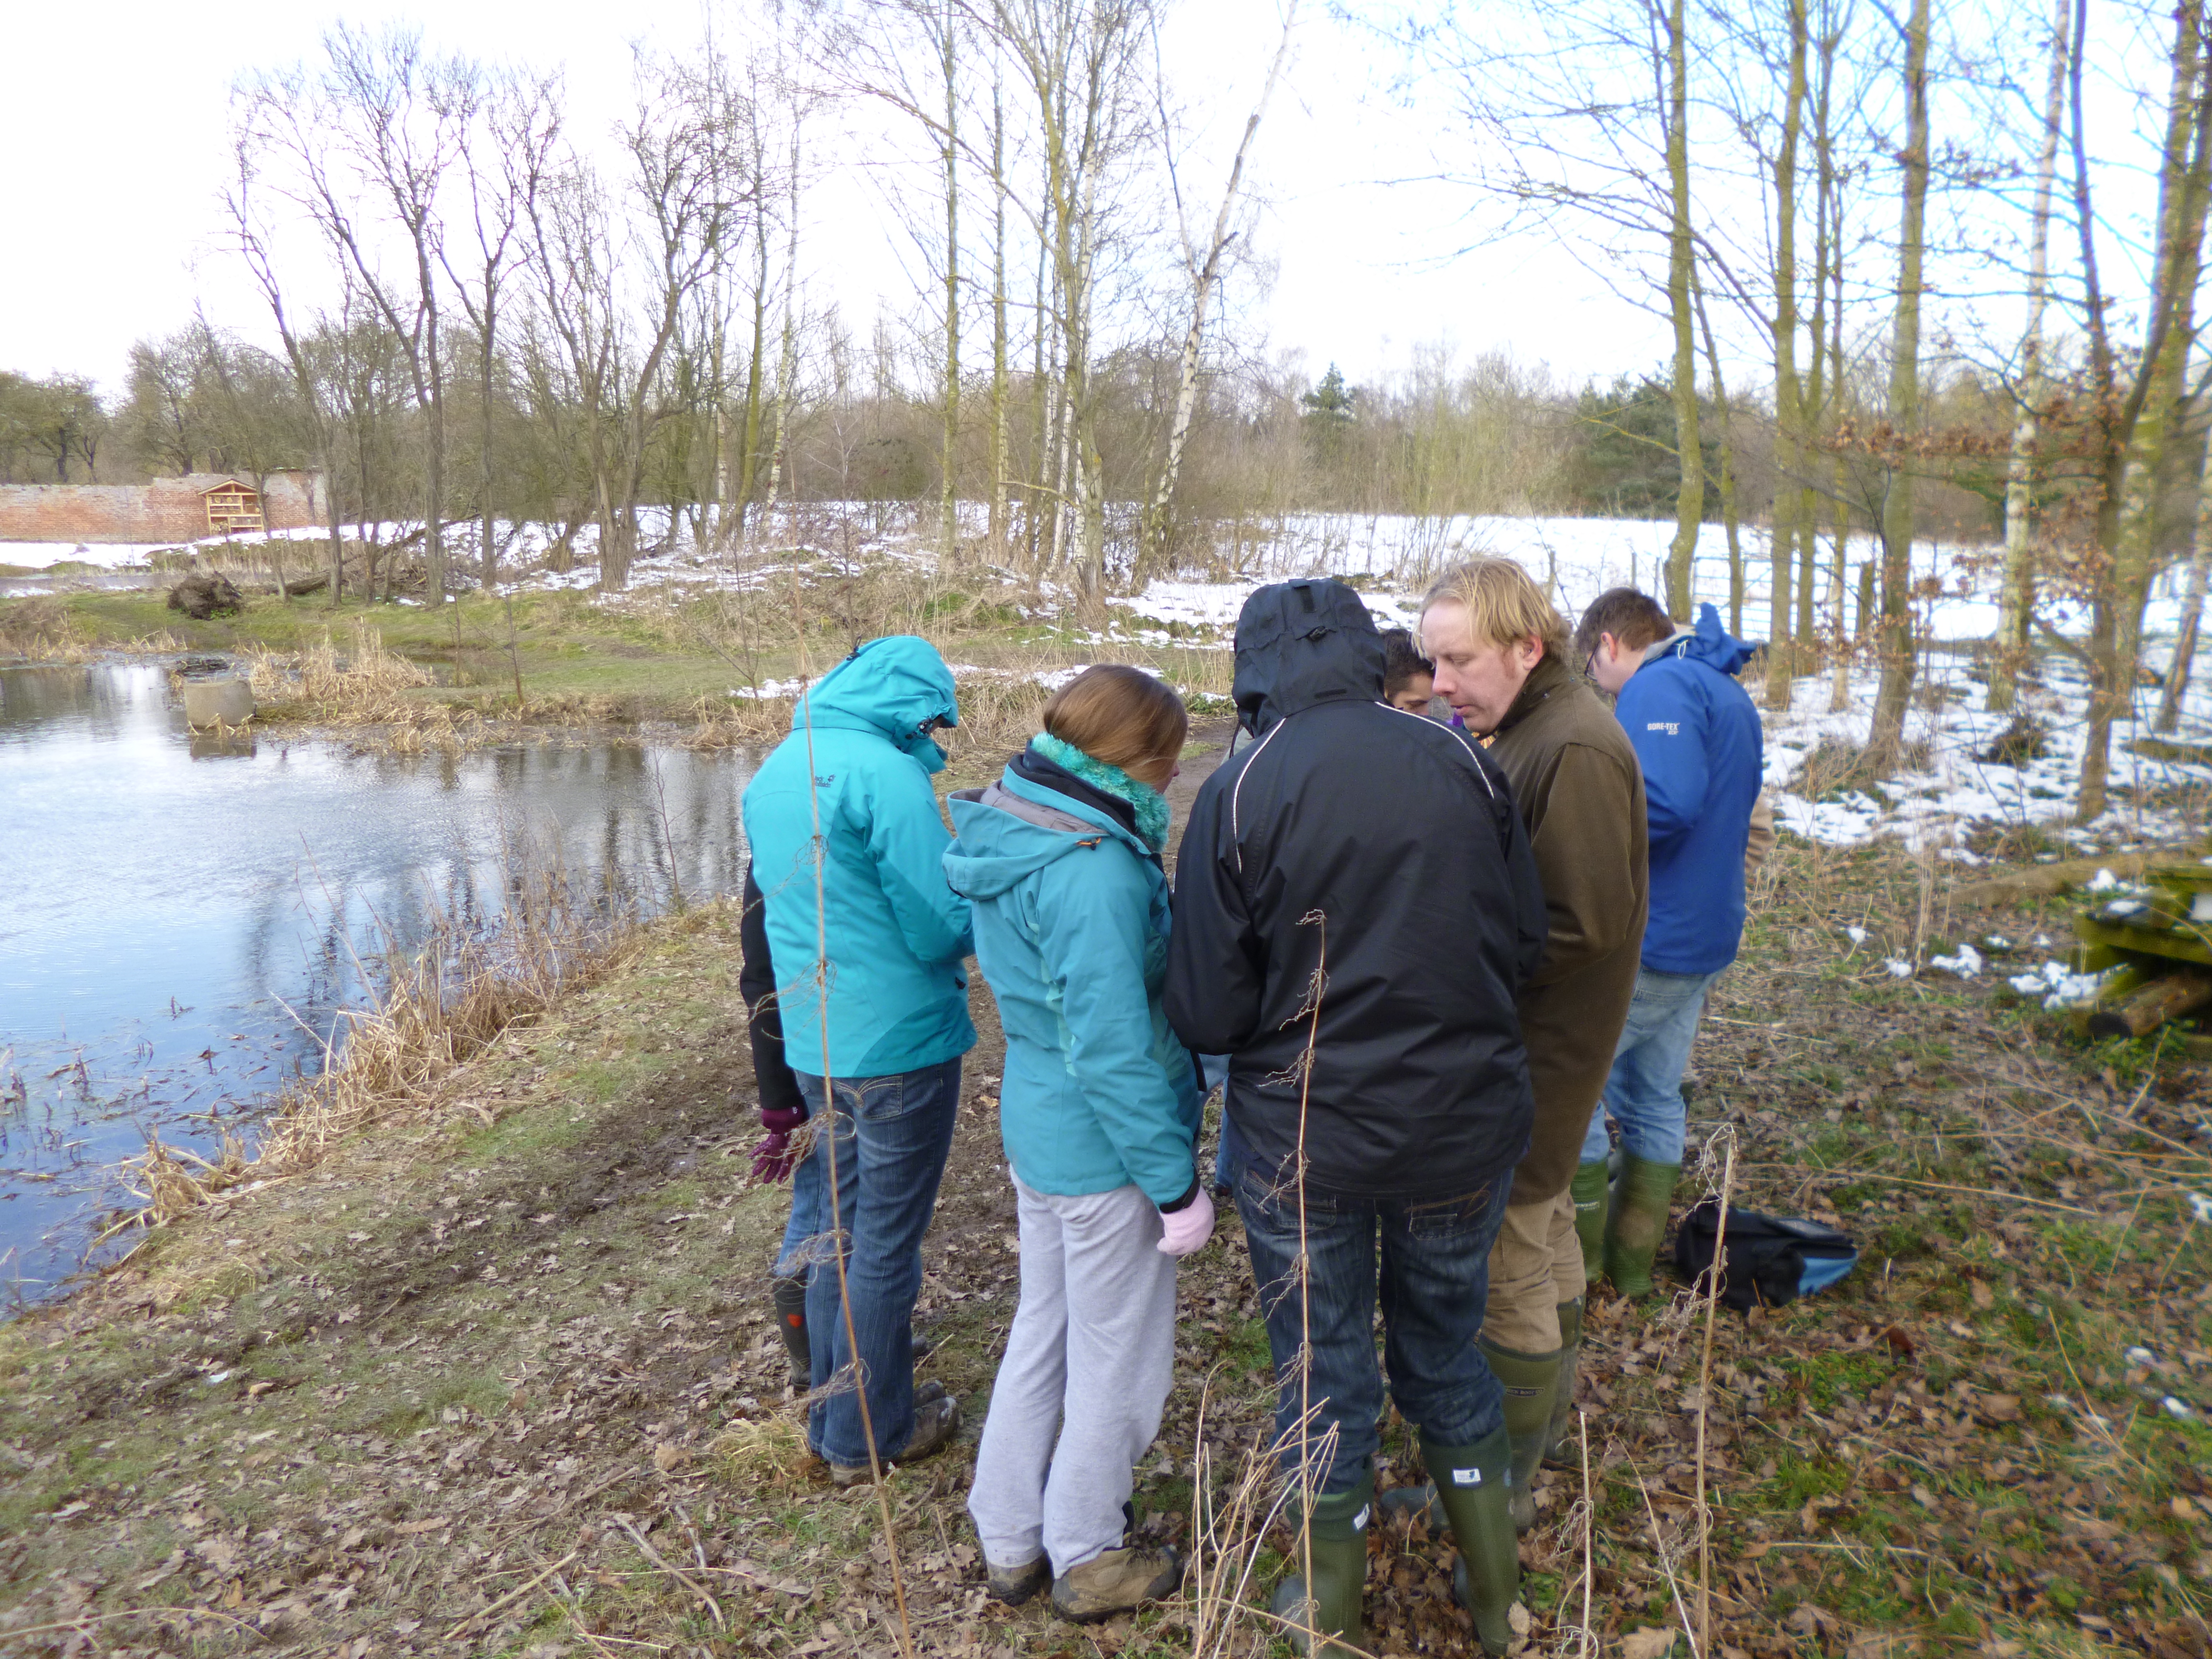
We used a laptop as a web server with a battery-powered local wireless network. The website running on the laptop server was accessed using four Samsung Galaxy tablets (three used by the tutors working in pairs, and another used by Dave an Javi). We briefly introduced the equipment and the website, then handed out the tablets and helped to make sure everyone could log in.
The FSC tutors then added some example data points. They were able to use the web form to add data without any additional prompts or instruction. We then discussed the data-collection form and potential improvements. The discussion then moved on to viewing the data, so we looked at the two example data views for biotic and abiotic pond data, which prompted further comments. We then discussed showing charts and graphs of the data as it is being entered, and ways of supporting data analysis (within and across groups).
The following notes try to capture the main points from the discussion:
- Overall impression
- Overall, the tutors were very positive. There were lots of suggestions from the tutors of ways that they could use the system. Even though the site is incomplete, they were able to see what type of support the site would provide and they did not seem daunted by the technology. All of the suggestions were well considered and very constructive, and gave us lots more ideas of what could be done.
- Specific comments, preferences and suggestions
- Tidy data: A couple of tutors mentioned a preference for having data in organised and familiar formats, such as tables.
- Habitat based data collection: Data collection is done at a habitat location for several data points. So, to minimise the number of clicks, when a form is submitted the user could then be taken back to add more data at the last location (e.g. to add more data at mud habitat, until they move on to open water), or a second submit button could be added to the data collection form – one to ‘Save and add another at a different location’ and the other to ‘Save and add another at the same location’.
- Editing existing data: The tutors commented that it is important to be able to modify data easily and predictably. For example, to edit an existing data point rather than adding another data point and assuming the system will know to use the total/average value. One suggestion was to provide a view of the data entered so far (at that habitat location e.g. mud) that fills up as more data is added – this would help users see their progress – and an additional ‘edit’ link could be included alongside each item to make it easier to modify existing data.
- Invertebrate descriptions for biotic data: There was a suggestion from the tutors that if descriptions of each invertebrate and key recognition characteristics could be added to the system that might complement the use of the invertebrates key. It was also pointed out that the fields used might need to be tailored for each audience, for example the use of latin names by A-level and adult groups. In our follow up discussion (after working with the tutors), prompted by the discussion of additional fields for describing animals, Jim also explained the hierarchy used for names, specifically: kingdom, phylum, class, order, family, genus, species. Jim also noted that there is a commonly used convention that genus and species are displayed in an italic font while the others (i.e. kingdom, phylum, class, order and family) are displayed in standard font. It would be ideal if we could follow this structure and formatting convention for fields in the invertebrate taxonomy (and any other taxonomies of living things).
- ‘How to’ guides for using equipment: There was also a suggestion from the tutors that some guidance information on how to operate relevant meters or probes would be useful for users. For example, the abiotic data is collected using the following equipment: oxygen meter, pH meter, nitrate test kit, phosphate test kit, turbidity tube. For each device we could include a block of text with images and/or a video that explains/demonstrates how to use it. The tutors offered to help produce these resources (i.e. the text, images and video clips).
- Results output and graphs: The tutors explained that they use pie charts or bar charts to present the data collected at each habitat (i.e. mud, open water and weed). For example, using counts of invertebrates collated at their trophic level (i.e. herbivore, carnivore, and detritivore). The trophic level of each invertebrate is included in the existing Excel spreadsheet. Most feed at only one level, but there are some cases, where the species cannot be identified so the genus or family is used instead, in these cases some species feed at different levels. In these cases, the total count for that invertebrate is halved for each category (e.g. 26 total = 13 herbivore + 13 detritivore).
- Progress overview: We also discussed the development of a data view for teachers/tutors so that they could see the progress of each group in a summary/compact format. This could be used to help monitor progress and identify potential data collection errors.
- Trophic pyramids (pyramid of number, biomass and energy): The tutors also enquired if the data collected could be presented in the form of trophic pyramids. The Excel spreadsheet for this activity includes the necessary equations for each invertebrate. It would be ideal if we could show both the student’s own data counts AND the total data for that habitat from the previous 12 months. Jim explained (afterwards) that the seasonal variation for species means that summing the data across the year is a more robust measure than using data from a single group on a specific day.
- Photographs to complement data: One of the last enquiries was to ask if groups could add photos and notes to their data. For example, to associate a photo of the habitat on the day the data was collected at the pond. This was also seen as useful for the river activity, where a photo at each river location and some notes/comments could be added at each data collection location.
 Adding data about the pond habitats
These give us plenty to things to work on over the next few weeks. The plan is to address these in the next set of revisions we make to the website. Hopefully, the same tutors will give us further feedback when these changes have been made.